Research for traders

Research Reports

Eagle Eye Equities

Tug of war

Riveting Metals

Gold – Inside Bar

High Noon

Bears stay dominant

Commodity Morning View

Trump imposes additional 25% tariffs on India

Commodity Info Kit

Commodity Info Kit dated August 07, 2025

Eagle Eye Commodity

Eagle Eye Commodity dated August 07, 2025

Technical Education

Get to the heart of the matter with Technical analysis through forecasts of price direction.

Price channel
Trend line
Know Sure Thing (KST)
MACD
Relative Strength Indicator
Bollinger bands
Volumes
Candlestick chart
Bar chart
Line chart
Price Channel
  • This is a continuation pattern that slopes up or down and is bound by an upper and lower trend line, where the upper trend line marks resistance and the lower trend line marks support
  • Price channels with negative slopes (down) are considered bearish and those with positive slopes (up) are considered bullish
  • Bullish Price channel
  • As long as prices advance and trade within the channel, the trend is considered bullish
  • The first warning of a trend change occurs when prices fall short of channel line resistance
  • Bearish Price channel
  • As long as prices decline and trade within the channel, the trend is considered bearish
  • The first warning of a trend change occurs when prices fail to reach channel line support
Bullish Price channel
IMAGE 1
Bearish Price channel
IMAGE 2
Trend Line
  • Trend lines are an important tool in technical analysis for both trend identification and confirmation
  • It is just a straight line connecting two or more price points extending into the future to act as a line of support or resistance
  • Principles applicable to support and resistance levels can be applied to trend lines
  • Technical traders pay close attention when a price approaches a trend line, as they play a major role in determining the short-term direction of an asset's price
  • As the price nears a major support/resistance level, the following can happen: The price will bounce off the trend line and continue in the prior trend, or it will move through the trend line signaling that the current trend is reversing or weakening
Bullish Trend line
Bearish Trend line
Know Sure Thing(KST)
  • KST is a momentum oscillator based on the smoothed rate-of-change for four different time frames
  • KST measures price momentum for four different price cycles
  • KST is simply a weighted average of four different rate-of-change values that have been smoothed
  • We can look for divergences, signal line crossovers and centerline crossovers
Crossovers
Divergence
Moving Average Convergence/Divergence (MACD)
  • Moving average convergence divergence (MACD) is a trend-following momentum indicator that shows the relationship between two moving averages of prices
  • The MACD is calculated by subtracting the 26-day exponential moving average (EMA) from the 12-day EMA
  • A 9 EMA of the MACD, called the 'signal line', is then plotted on top of the MACD, functioning as a trigger for buy and sell signals
  • There are two common methods used to interpret the MACD:

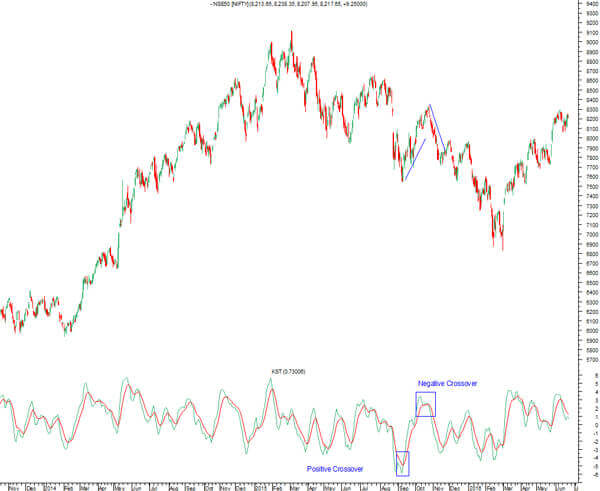
Crossovers - As shown in the chart below, when the MACD falls below the signal line, it is a bearish signal, which indicates that it may be time to sell. Conversely, when the MACD rises above the signal line, the indicator gives a bullish signal, which suggests that the price of the asset is likely to experience upward momentum.

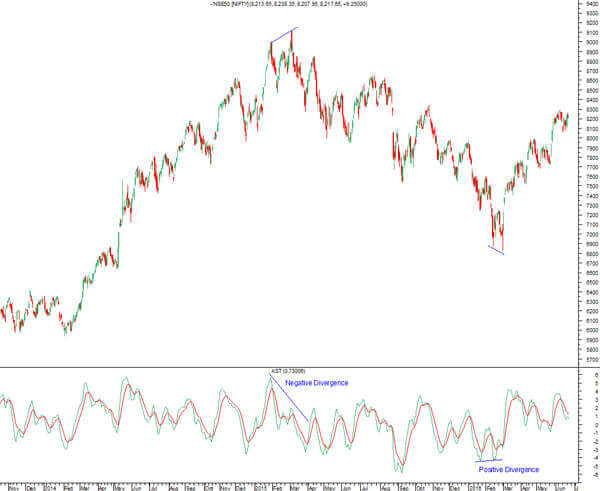
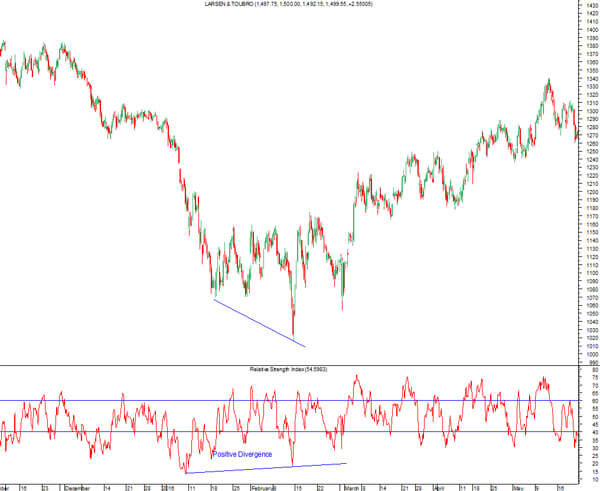
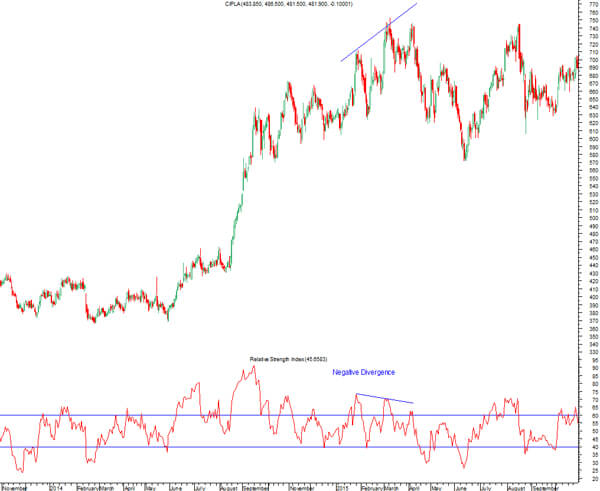
Divergence - When the security price diverges from the MACD, it signals the end of the current trend.

Crossovers
MACDCrossover
Divergence
Relative Strength Indicator(RSI)
  • The Relative Strength Indicator (RSI) is a momentum oscillator that measures the speed and change in price movements
  • RSI oscillates between zero and 100
  • RSI is considered overbought when above 70 and oversold when below 30
  • Signals can also be generated by looking for divergences, failure swings and centerline crossovers
Divergences
  • The Relative Strength Indicator (RSI) is a momentum oscillator that measures the speed and change in price movements
  • RSI oscillates between zero and 100
  • RSI is considered overbought when above 70 and oversold when below 30
  • Signals can also be generated by looking for divergences, failure swings and centerline crossovers
Bullish Divergences
Bullish Divergences
Bollinger Bands
  • These are volatility bands placed above and below a moving average
  • Volatility is based on standard deviation that changes as volatility increases or decreases
  • The bands automatically widen when volatility increases and narrow when volatility decreases
  • The dynamic nature of Bollinger Bands mean that they can be used on different securities with the standard settings
  • Bollinger Bands consist of a middle band and two outer bands.
  • The middle band is a simple moving average set at 20 periods, which is used as the standard deviation formula
  • For signals, Bollinger Bands can be used to identify M-Tops and W-Bottoms or to determine the strength of the trend
  • Would you like to understand Bollinger Bands and other such theories at ease or have any questions about them? Just drop us a message or
    Enroll for a free learning session with our experts
Double - Tops
  • There are four steps to confirm a W-Bottom with Bollinger Bands
  • A reaction low forms, which is usually, but not always, below the lower band.
  • There is a bounce towards the middle band
  • There is a new price low in the security, which holds above the lower band and this shows less weakness on the last decline
  • The pattern is confirmed with a strong move off the second low and a resistance break
Volumes
  • A tiger knows the value of volumes, after all, it indicates change
  • Volume is used to confirm trends and chart patterns
  • Any price movement up or down with high volume is seen as a stronger move
  • If you are looking at a large price movement, you must examine volume to see whether it tells the same story
  • Volume plays a vital role in chart pattern confirmation
  • Patterns such as head and shoulders, triangles, flags and other patterns can be confirmed with volume
Volume
 
Candlestick Chart
  • The candle stick chart is similar to a bar chart
  • It has a thin vertical line showing a particular period's trading range
  • The wide bar on the vertical line indicates the difference between open and close prices
  • When the price of the stock is up and closes above the opening trade, the candlestick is white or clear.
  • When the price of the stock is down, the candlestick will be red or black
  • If the stock has closed above the previous day but below the day's open price, the candlestick will be black or filled with the colour used to indicate an up day
Candlestick
 
Bar Chart
  • Even the smallest piece of added information adds on to an opportunity, just like the bar chart
  • The lines in the chart represent highs and lows for a trading period, along with closing price
  • Close and open prices are represented on the vertical line with a dash
  • The opening price is indicated as a dash on the left bar, while the closing price as a dash on the right
  • If the left dash is lower than the right dash then the bar will be shaded black - indicating an up period for the stock
  • A red bar signals that the stock has gone down in value (in this case, the dash on the right (close) is lower than the dash on the left (open))
BarChart
Line Chart
  • Know the markets at a glance with Line charts
  • This basic chart represents closing prices over a period of time
  • The line is formed by connecting closing prices without using high, low and opening prices
  • With this chart you will get a firm grasp on the closing price for the day

Info for Traders

Market Report- Markets trade lower on doubling India tariff

Indian markets open lower on on additional Trump Tariffs

Post Market Update- Sensex down 166 points, Nifty below 24,600

Indian stock markets close lower on RBI policy day.

Market Report- Markets trade flat. RBI policy in focus

Indian stock markets open flat ahead of RBI Policy meet outcome

Post Market Update- Sensex down 296 points, Nifty below 24,800

Indian stock markets close lower after fresh tariffs on India.

Midday Report- Markets see sharp recovery. Nifty above 24,850

Indian stock markets erase their losses, trade flat.

Market Report- Markets trade lower on Trump's tariff move

Indian markets open lower after US President Donald Trump announces 25% tariff in India

Learning Center

In the interest of investor education, we bring you a comprehensive library of videos, articles and our bespoke initiative, Mirae Asset Sharekhan to help you gain a deeper understanding of mutual funds and to give you the knowledge and resources necessary to choose your desired MF scheme. From catering to new market entrants to veteran investors, we have it all. Explore away!

Learning Center
OPEN FREE* DEMAT ACCOUNT