Sharekhan Platforms Features

FeaturesAppTradeTigerWebsite
MarketWatch Yes Yes Yes
Charting Yes Yes No
Orders Yes Yes Yes
Stock Scanner No Yes No
Pattern Finder Yes No Yes
Advanced Option Chain Yes Yes No
Market Movers Yes Yes No
In-Built Research Yes Yes No
Dynamic Alerts No Yes No

MarketWatch – the optimized Watchlist

< Suitable for New-to-markets | Traders | Investors >

Get ready to stay ahead in the market

Embrace the power of Market Watch and elevate your investing and trading experience. Start building your personalized Watchlist today and gain a competitive edge. Market Watch is a powerful tool that empowers you to monitor, track and analyse your favourite stocks effortlessly. Let's explore how market watch can help you stay ahead in the market

Key features of MarketWatch

an image
Personalization

Build your personalized MarketWatch by adding stocks of your choice to your Watchlist. Keep a close eye on the performance of your investments, including real-time price updates, daily changes and more. Stay connected to your investments!

an image
Intelligent Automation

EZYOption Watchlist harnesses the power of intelligent automation to streamline tasks and save you valuable time. Say goodbye to the manual process and tedious work of creating an Option Watchlist. The EZYOption Watchlist feature creates fresh Option Watchlists for you every day basis Spot Price!

an image
Real-Time Market Data

Access real-time market data for all the stocks on your Watchlist. Stay up to date on the latest prices, volume and key metrics that impact your investment decisions. Monitor market trends and respond quickly to market fluctuations, ensuring you never miss a beat.

an image
Customizable Alerts

Set personalized alerts based on price movements or specific events. Receive instant notifications via email, SMS & app notifications, keeping you informed about the stocks that matter most to you. Take advantage of timely alerts to make informed trading decisions.

an image
News and Insights

Stay informed with curated news and insights directly within your Watchlist. Access relevant news articles, reports and market updates to understand the factors driving stock performance. Stay ahead of the game by staying informed with the latest information.

an image
Seamless Integration

Seamlessly integrate your MarketWatch with MS Excel. Simplify your workflow!

Heatmap – Visualize market trends at a glance

< Suitable for New-to-markets | Traders | Investors >

Navigating the complexities of the financial market requires a deep understanding of market trends and dynamics. To simplify your analysis and provide you with valuable insights, we have developed Heatmap – an innovative tool that visualizes market data in a clear and intuitive way. Let's explore how Heatmap can optimize how you monitor and interpret market trends.

Key features of Heatmap

Instant Market Overview

Get a bird's eye view of the market with our intuitive Heatmap. Instantly visualize the performance of various securities, sectors or indices in a color-coded format. Quickly identify hotspots of activity, gain an understanding of the broader market sentiment, and make informed decisions.

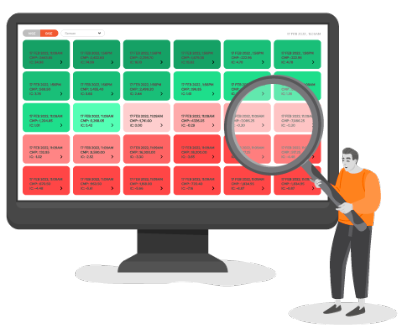
Color-Coded Data Visualization

Our Heatmap employs a color-coded system to represent different performance metrics. Easily identify areas of strength, weakness, or neutrality with just a quick glance.

Customizable Data Parameters

Tailor the Heatmap to your specific needs – by selecting the data, you can convert your Watchlist into a Heatmap! Customize by choosing specific indices or securities or select performance metrics to display. Adapt the Heatmap to align with your trading or investment strategy and focus on the data that impacts your decisions.

Interactive and Real-time Updates

Interact with the Heatmap and receive real-time updates as the market evolves. Zoom in or out to explore different sectors and stocks, and hover over individual cells for detailed information. Stay connected to the market in real-time and gain actionable insights.

User-Friendly Interface

Our Heatmap features an intuitive and user-friendly interface designed for seamless navigation and ease of use. Whether you're a seasoned investor or just starting your investment journey, our Heatmap provides a visually engaging and accessible tool for market analysis.

Charting – Visualize, Analyse and Act

< Suitable for New-to-markets | Traders | Investors >

In the world of investing, having access to powerful charting tools is essential for making informed decisions and staying ahead of market trends. Our platform provides you with robust charting capabilities that allow you to visualize, analyse and act on critical market data. Let's dive into the features and benefits of our charting tools and see how they can empower you in your investment journey.

Key Charting features to look out for

an image Dummy
Dynamic Charting Interface

Our platform offers a dynamic and user-friendly charting interface that puts the power of data visualization at your fingertips. Effortlessly navigate through charts, zoom in and out, and customize the display to focus on the information that matters most to you. Our intuitive interface ensures a seamless charting experience for investors of all levels.

an image Dummy
Multiple Chart Types

Choose from a wide range of chart types to suit your analytical needs. Whether you prefer line charts, bar charts, candlestick charts or more advanced chart types like Renko our software has you covered. Visualize price movements, patterns and trends in a format that resonates with your analysis style.

an image Dummy
Technical Indicators and Overlays

Enhance your charting analysis with a comprehensive selection of technical indicators and overlays. From moving averages and oscillators to trend lines and volume indicators, our software provides you with a rich library of tools to gauge market sentiment, identify entry and exit points and validate your investment decisions.

an image Dummy
Drawing and Annotation Tools

Annotate your charts with ease using our drawing tools. Draw trend lines, support and resistance levels, Fibonacci retracements, and other key annotations to highlight important price levels and patterns. Mark up your charts to visualize your analysis and share insights with your fellow traders.

an image Dummy
ZERO Noise

Easy-to-understand reports and trained on-boarding managers handling your service requests make your entry into the markets smooth as ever.

Placing Orders – Efficient, Effective, Transparent

< Suitable for Traders | Investors >

In the world of trading and investment, executing orders efficiently and effectively is essential for maximizing returns and managing risk. Our software provides you with a range of order placement options that empower you to take control of your trades. Let's dive into the different types of order placement available and discover how they can enhance your trading and investment strategies.

Why we’re proud of our Order Window and its features

Market Orders

Execute trades at the prevailing market price with market orders. This type of order ensures quick execution, as it prioritizes speed over price. Market orders are ideal when you want to enter or exit a position swiftly, especially in highly liquid markets.

Limit Orders

Set specific price levels at which you want your trades to be executed with limit orders. With limit orders, you have more control over the execution price. Specify the maximum price you are willing to pay for a buy order or the minimum price you are willing to accept for a sell order. Limit orders are useful for who want to be precise with their entry and exit points.

Stop-loss Trigger Orders

Protect your positions and manage risk with stop orders. These orders are triggered when a specific price level, known as the stop price, is reached. A stop order can be used for both buying and selling securities. A buy stop order is placed above the current market price to trigger a purchase if the price surpasses a certain threshold. A sell stop order is placed below the current market price to trigger a sale if the price falls below a specified level.

Trailing Stop Orders

Protect profits and minimize losses with trailing stop orders. These orders are designed to follow the price trend and adjust the stop price accordingly. If the market price moves in your favour, the stop price is dynamically adjusted to a certain percentage or price distance below the current market price. Trailing stop orders allow you to capture gains while giving your trades room to breathe.

Bracket Orders

Employ a comprehensive trading strategy with bracket orders. These orders consist of a market order followed by a pair of limit orders. When the market order is executed, the limit orders are automatically placed above and below the execution price, creating a profit target and a stop-loss level simultaneously. Bracket orders offer a systematic approach to managing risk and taking profits.

Stock SIP

Looking for a disciplined and systematic approach to investing in stocks? Look no further than Stock SIP—a revolutionary investment strategy that allows you to invest in stocks at regular intervals. With Stock SIP, you can harness the power of compounding and navigate market volatility with confidence. (Only available on Website)

Extended Trading Opportunities with AMO

AMO (After Market-hours Orders) trading provides access to the market outside regular trading hours. Take advantage of significant news releases, earnings reports, or other market-moving events that occur before or after the standard trading session. With after-hours order placement, you can be proactive and act swiftly on new information.

Advanced Analytics and Insights

< Suitable for Traders | Investors >

Prepare to embrace a new era of technology with our platform innovative features. Unlock valuable insights and make data-driven decisions with our advanced analytics capabilities. Gain deep visibility into your performance, trends, and patterns. Leverage powerful analytics tools and visualizations to derive actionable insights and drive your success.

What the hype is all about

image

Stock Scanner

Tailor your search to match your investment goals using our customizable search criteria. Define parameters with technical indicators to narrow down the stocks that align with your strategy. Filter out noise and focus on the stocks that matter most to you. (Only available on TT)

image

Pattern Finder – Advanced Pattern Recognition

Our Pattern Finder tools utilize advanced algorithms and pattern recognition techniques to scan vast amounts of market data. Whether you are looking for classic Chart patterns like head and shoulders, triangles, or double tops, or more complex patterns, our tools are equipped to identify them (Only available on App & Website)

image

Advanced Option Chain

Option Chain is your gateway to a wealth of information and insights, offering a holistic view of the Option market. Access real-time and historical data on a wide range of Options contract. Explore the entire Option market wth ease, effortlessly identifying Option Chains for various securities. Stay updated on pricing, volume, open interest, and other critical data points that shape your trading decisions. (Only available on App & TT)

image

Market Movers

Scan real-time market data on thousands of stocks, ensuring you stay up to date with the latest information. Monitor stock prices, trading volume, volatility, and other key metrics that impact your investment decisions. React quickly to changing market conditions and seize opportunities in real time. (Only available on App & TT)

image

In-built Research

Gain access to a wealth of research calls and reports that cover a wide range of markets, sectors, and securities. Our in-built research provides you with valuable insights, expert analysis, and up-to-date information to guide your investment decisions. Stay informed about market trends, economic developments, and the latest news that could impact your portfolio. (Only available on App & TT)

image

Dynamic Alerts

Discover hidden opportunities with innovative tools designed to help you identify hidden opportunities in the stock market. With advanced algorithms and comprehensive market data, dynamic alert tool empowers you to uncover stocks that meet your specific criteria and trading strategy. (Only available TT)